Boston Data Con for Social Good : Tulalens
Earlier this month, I attended Boston Data Con for Social Good in August 2015 There were many interesting presentations, project description / introductions by various people working on different “Social Good” problems. One of them was Tulalens.
Among its other goals, Tulalens helps low-income women in slums access better healthcare services available to them. The founder of Tulalens, Priya presented a dataset containing various parameters about these women like, Age, income, family size, number of children, other health information like number of doctor visits, health outcome etc. In all the dataset size was not so big, but had 97 columns. So the number of parameters to look at was very wide.
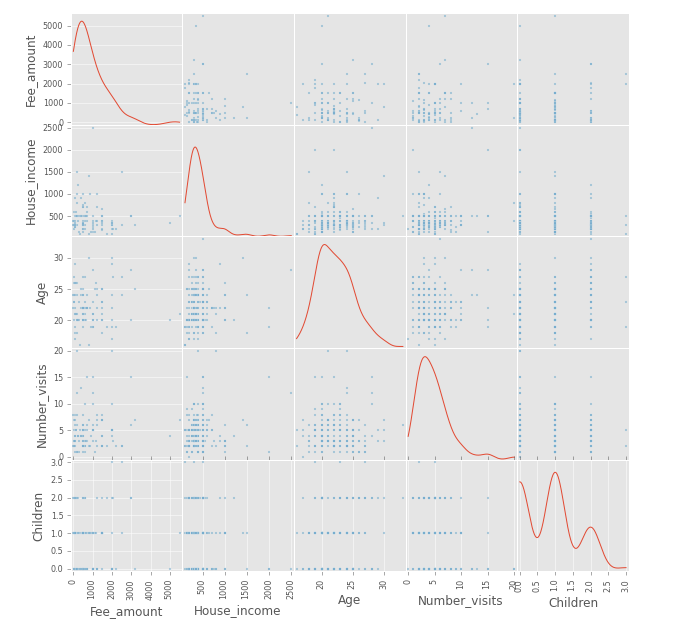
We used pandas(python) to analyze the data. A small snippet of the code and the output screenshot are posted below. The scatter matrix shows a section of data. Since there were 97 variables in the dataset, there were plenty of avenues to inspect.
Here is the snippet of code used to generate the image at the beginning of the post.
from pandas.tools.plotting import scatter_matrix
subset = data[["Fee_amount", "House_income", "Age", "Number_visits", "Children"]]
scatter_matrix(subset, figsize=(10,10), diagonal="kde")
The Data Con was a great experience to immerse into an unknown dataset and figure out patterns or interesting aspects of the data collected.